최종 수정 일자: 2020-06-13 12:34
해당 카테고리에 작성되는 글은 Introduction to Machine Learning with Python(파이썬 라이브러리를 활용한 머신 러닝)을 기반으로 작성되었습니다.

데이터 셋 다루기
앞으로 다룰 알고리즘을 설명하기 위해서 다양한 테스트 셋을 사용할 것입니다. 일부 데이터 셋은 크기가 작으며 각 알고리즘의 특정 부분을 잘 강조할 수 있도록 디자인된, 만들어진 데이터 셋일 것이며, 실제로 사용되는 크기가 큰 데이터 셋들도 있습니다. 데이터 셋이 어떠한 구조로 되어 있으며 어떻게 읽고 학습을 시킬 것인지를 배워보도록 하겠습니다.
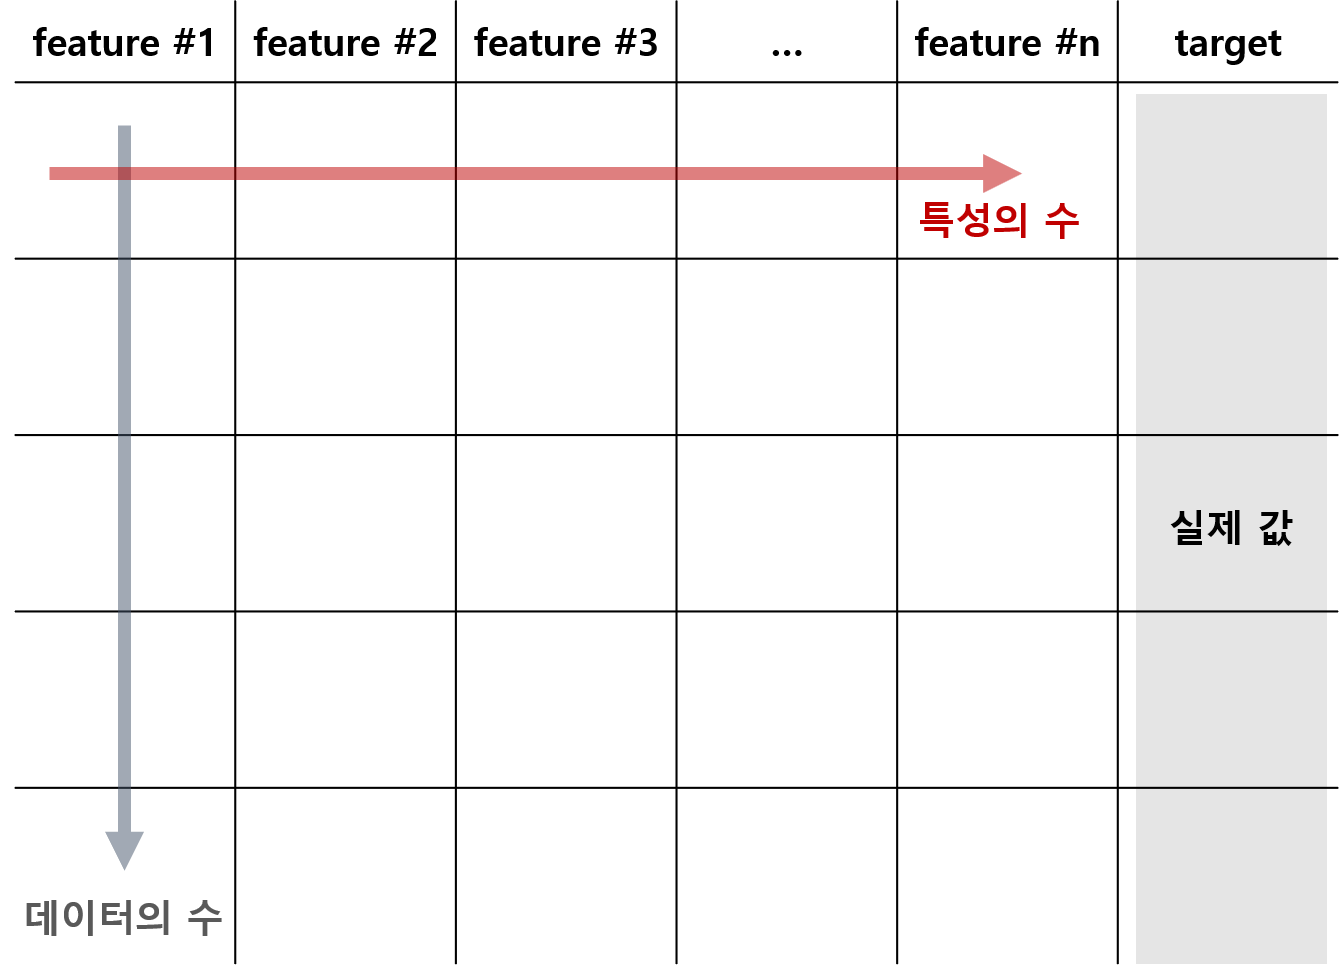
데이터 셋은 특성(feature)과 결과값(target, label)로 구성되어 있습니다. 단순하게 특성은 독립변수를, 결과값은 (특성에 의해서 결정된다고 믿어지는) 종속변수에 해당됩니다. 그러나 특성이 반드시 하나일 필요는 없으며 특성의 개수를 데이터 셋의 차원(dimension)이라 합니다. 데이터 셋을 시각화하면 다음과 같습니다.

우선 binary classification의 예시로서 사용될 만들어진 데이터 셋인 forge 데이터 셋을 봅시다. 기본적으로 numpy, matplotlib, pandas, mglearn은 모듈 임포트 된 상황입니다.
| import numpy as np import matplotlib.pyplot as plt import pandas as pd import mglearn |
이제 데이터를 불러와봅시다.
| # forge dataset X, y = mglearn.datasets.make_forge() print(X, '\n', type(X), '\n', X.shape) print(y, '\n', type(y), '\n', y.shape) |
결과)
| [[ 9.96346605 4.59676542] [11.0329545 -0.16816717] [11.54155807 5.21116083] (생략) [11.563957 1.3389402 ]] <class 'numpy.ndarray'> (26, 2) [1 0 1 0 0 1 1 0 1 1 1 1 0 0 1 1 1 0 0 1 0 0 0 0 1 0] <class 'numpy.ndarray'> (26,) |
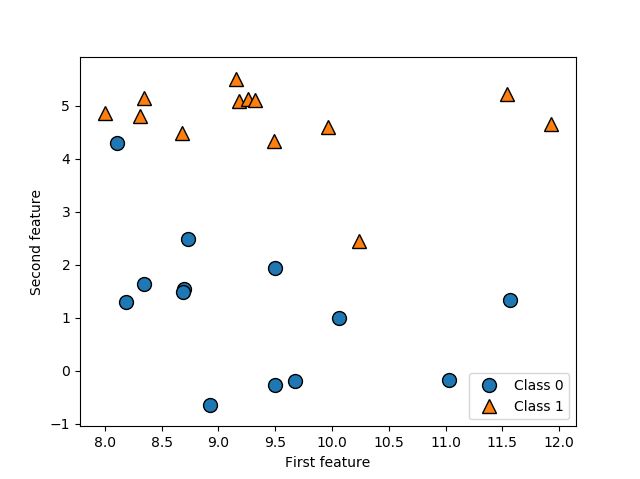
처음 X, y = mglearn.datasets.make_forge()는 mglearn 패키지로부터 forge 데이터 셋을 불러오며 feature에 해당되는 배열을 X에, target에 해당되는 배열을 y에 할당하겠다는 뜻입니다. 우선 X의 형태를 보면 numpy.ndarray class의 오브젝트이며, 26개의 행과 2개의 열을 갖고 있음을 알 수 있습니다. 즉, 총 26개의 데이터로 구성되어 있으며 특성은 두 개 입니다. 각 데이터는 [feature #1, feature #2]와 같이 각 특성에 해당되는 값들로 이루어진 numpy.ndarray 오브젝트입니다. y는 26개의 값으로 구성된 numpy.ndarray 오브젝트로 각 X의 데이터에 대응하는 클래스(클래스0 또는 클래스1)인지를 나타냅니다. 해당 데이터 셋을 시각화하는 코드를 실행시켜봅시다.
| X, y = mglearn.datasets.make_forge() mglearn.discrete_scatter(X[:, 0], X[:, 1], y) plt.legend(["Class 0", "Class 1"], loc=4) # loc는 그래프 레전드의 위치 설정 입력변수 plt.xlabel("First feature") plt.ylabel("Second feature") plt.show() |
결과)

특성이 두 개이기 때문에 각 특성을 x축과 y축으로 하는 그래프를 작성할 수 있습니다. 또한 각 데이터 포인트가 속한 실제 클래스가 표시되어 있습니다.
다음은 회귀 알고리즘을 배우기 위해 만들어진 데이터 셋인 wave dataset을 봅시다.
| # wave dataset X, y = mglearn.datasets.make_wave(n_samples=40) print(X, '\n', type(X), '\n', X.shape) print(y, '\n', type(y), '\n', y.shape) |
결과)
| [[-0.75275929] [ 2.70428584] [ 1.39196365] (생략) [-0.35908504]] <class 'numpy.ndarray'> (40, 1) [-0.44822073 0.33122576 0.77932073 0.03497884 -1.38773632 -2.47196233 -1.52730805 1.49417157 1.00032374 0.22956153 -1.05979555 0.7789638 0.75418806 -1.51369739 -1.67303415 -0.90496988 0.08448544 -0.52734666 -0.54114599 -0.3409073 0.21778193 -1.12469096 0.37299129 0.09756349 -0.98618122 0.96695428 -1.13455014 0.69798591 0.43655826 -0.95652133 0.03527881 -2.08581717 -0.47411033 1.53708251 0.86893293 1.87664889 0.0945257 -1.41502356 0.25438895 0.09398858] <class 'numpy.ndarray'> (40,) |
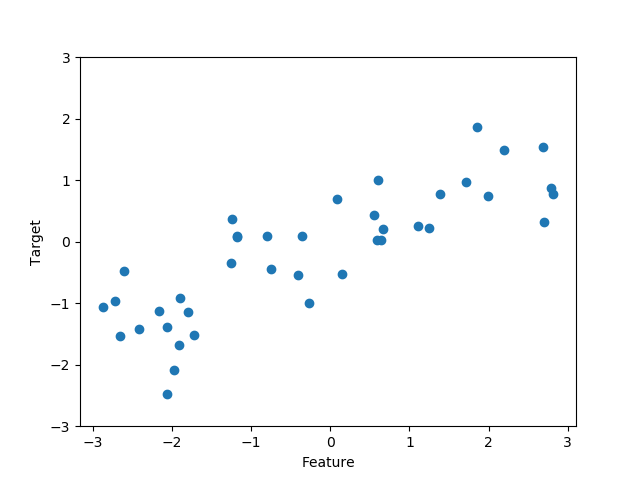
wave 데이터 셋은 40개의 데이터 포인트를 갖고 있으며, 특성은 하나입니다. 이때 결과값이 이산적인 집단인 클래스 라벨링이 아니라, 연속적인 실수 집합의 한 값입니다. 이를 시각화하면 다음과 같습니다.
| X, y = mglearn.datasets.make_wave(n_samples=40) plt.plot(X, y, 'o') plt.ylim(-3, 3) plt.xlabel("Feature") plt.ylabel("Target") plt.show() |
결과)

위 예시의 데이터 셋은 단순하고 낮은 차원(특성의 수가 적은)의 데이터 셋으로, 인위적으로 만들어진 데이터 셋입니다. 실제 데이터 셋은 특성의 수가 매우 많은 높은 차원의 데이터 셋일 가능성이 높으며 이는 scikit-learn 패키지 내에서 일부 제공하고 있습니다. 이러한 데이터를 살펴봅시다. 가장 먼저 살펴볼 것은 위스콘신 유방암 데이터 셋으로, 유방암 종양의 임상 측정 결과를 기록해 놓은 것입니다. 각 종양은 benign(양성)과 malignant(악성)이라는 클래스로 구분되며 따라서 분류(classification) 문제 해결을 위한 데이터 셋입니다.
| from sklearn.datasets import load_breast_cancer cancer = load_breast_cancer() print("cancer.keys(): \n{}".format(cancer.keys())) |
결과)
| cancer.keys(): dict_keys(['data', 'target', 'target_names', 'DESCR', 'feature_names', 'filename']) |
우선 해당 데이터 셋은 sklearn.datasets에서 정의된 class의 오브젝트로 print()를 통해 출력해보면 어마어마한 양의 데이터가 있음을 확인할 수 있습니다. 해당 데이터 셋은 딕셔너리 형태를 띠고 있으며 이를 좀 단순하게 표현하기 위해 우선 데이터 셋의 key에는 어떠한 것들이 있는지 조회해봅시다. 결과를 보면 data, target, target_names, DESCR, feature_names, filename이 딕셔너리의 key로서 존재합니다. 해당 key에 대응하는 value를 하나씩 읽어봅시다.
| from sklearn.datasets import load_breast_cancer cancer = load_breast_cancer() print("cancer.data: \n{}".format(cancer.data)) |
결과)
| cancer.data: [[1.799e+01 1.038e+01 1.228e+02 ... 2.654e-01 4.601e-01 1.189e-01] [2.057e+01 1.777e+01 1.329e+02 ... 1.860e-01 2.750e-01 8.902e-02] [1.969e+01 2.125e+01 1.300e+02 ... 2.430e-01 3.613e-01 8.758e-02] ... [1.660e+01 2.808e+01 1.083e+02 ... 1.418e-01 2.218e-01 7.820e-02] [2.060e+01 2.933e+01 1.401e+02 ... 2.650e-01 4.087e-01 1.240e-01] [7.760e+00 2.454e+01 4.792e+01 ... 0.000e+00 2.871e-01 7.039e-02]] |
데이터 셋 내의 모든 데이터를 보여줍니다. 데이터 셋의 구조를 출력해보면 다음과 같습니다.
| from sklearn.datasets import load_breast_cancer cancer = load_breast_cancer() print("cancer.data.shape: \n{}".format(cancer.data.shape)) |
결과)
| cancer.data.shape: (569, 30) |
즉, 569개의 데이터 포인트가 존재하며 30개의 특성을 갖습니다. 다음으로 target을 조회해 봅시다.
| from sklearn.datasets import load_breast_cancer cancer = load_breast_cancer() print("cancer.target: \n{}".format(cancer.target)) |
결과)
| cancer.target: [0 0 0 0 0 0 0 0 0 0 0 0 0 0 0 0 0 0 0 1 1 1 0 0 0 0 0 0 0 0 0 0 0 0 0 0 0 1 0 0 0 0 0 0 0 0 1 0 1 1 1 1 1 0 0 1 0 0 1 1 1 1 0 1 0 0 1 1 1 1 0 1 0 0 1 0 1 0 0 1 1 1 0 0 1 0 0 0 1 1 1 0 1 1 0 0 1 1 1 0 0 1 1 1 1 0 1 1 0 1 1 1 1 1 1 1 1 0 0 0 1 0 0 1 1 1 0 0 1 0 1 0 0 1 0 0 1 1 0 1 1 0 1 1 1 1 0 1 1 1 1 1 1 1 1 1 0 1 1 1 1 0 0 1 0 1 1 0 0 1 1 0 0 1 1 1 1 0 1 1 0 0 0 1 0 1 0 1 1 1 0 1 1 0 0 1 0 0 0 0 1 0 0 0 1 0 1 0 1 1 0 1 0 0 0 0 1 1 0 0 1 1 1 0 1 1 1 1 1 0 0 1 1 0 1 1 0 0 1 0 1 1 1 1 0 1 1 1 1 1 0 1 0 0 0 0 0 0 0 0 0 0 0 0 0 0 1 1 1 1 1 1 0 1 0 1 1 0 1 1 0 1 0 0 1 1 1 1 1 1 1 1 1 1 1 1 1 0 1 1 0 1 0 1 1 1 1 1 1 1 1 1 1 1 1 1 1 0 1 1 1 0 1 0 1 1 1 1 0 0 0 1 1 1 1 0 1 0 1 0 1 1 1 0 1 1 1 1 1 1 1 0 0 0 1 1 1 1 1 1 1 1 1 1 1 0 0 1 0 0 0 1 0 0 1 1 1 1 1 0 1 1 1 1 1 0 1 1 1 0 1 1 0 0 1 1 1 1 1 1 0 1 1 1 1 1 1 1 0 1 1 1 1 1 0 1 1 0 1 1 1 1 1 1 1 1 1 1 1 1 0 1 0 0 1 0 1 1 1 1 1 0 1 1 0 1 0 1 1 0 1 0 1 1 1 1 1 1 1 1 0 0 1 1 1 1 1 1 0 1 1 1 1 1 1 1 1 1 1 0 1 1 1 1 1 1 1 0 1 0 1 1 0 1 1 1 1 1 0 0 1 0 1 0 1 1 1 1 1 0 1 1 0 1 0 1 0 0 1 1 1 0 1 1 1 1 1 1 1 1 1 1 1 0 1 0 0 1 1 1 1 1 1 1 1 1 1 1 1 1 1 1 1 1 1 1 1 1 1 1 1 1 0 0 0 0 0 0 1] |
0 또는 1로 구성된 569개의 값의 배열이 등장합니다. 즉, 해당 데이터 포인트의 라벨링이 클래스0인지, 클래스1인지를 저장한 자료입니다. 클래스0과 클래스1의 이름이 궁금하다면 다음 코드로 확인할 수 있습니다.
| from sklearn.datasets import load_breast_cancer cancer = load_breast_cancer() print("cancer.target_names: \n{}".format(cancer.target_names)) |
결과)
| cancer.target_names: ['malignant' 'benign'] |
각 클래스 별로 데이터 포인트가 몇 개인지를 조회할 수도 있습니다.
| from sklearn.datasets import load_breast_cancer cancer = load_breast_cancer() print("Sample counts per class:\n{}".format({n: v for n, v in zip(cancer.target_names, np.bincount(cancer.target))})) |
결과)
| Sample counts per class: {'malignant': 212, 'benign': 357} |
30개나 되는 특성이 각각 어떤 것인지를 확인하고 싶다면 feature_names를 조회하면 됩니다.
| from sklearn.datasets import load_breast_cancer cancer = load_breast_cancer() print("cancer.feature_names: \n{}".format(cancer.feature_names)) |
결과)
| cancer.feature_names: ['mean radius' 'mean texture' 'mean perimeter' 'mean area' 'mean smoothness' 'mean compactness' 'mean concavity' 'mean concave points' 'mean symmetry' 'mean fractal dimension' 'radius error' 'texture error' 'perimeter error' 'area error' 'smoothness error' 'compactness error' 'concavity error' 'concave points error' 'symmetry error' 'fractal dimension error' 'worst radius' 'worst texture' 'worst perimeter' 'worst area' 'worst smoothness' 'worst compactness' 'worst concavity' 'worst concave points' 'worst symmetry' 'worst fractal dimension'] |
즉, 종양의 물리적 특성들을 측정하여 각 특성별로 정리한 자료임을 확인할 수 있습니다. 마지막으로 DESCR을 조회해봅시다.
| from sklearn.datasets import load_breast_cancer cancer = load_breast_cancer() print("cancer.DESCR: \n{}".format(cancer.DESCR)) |
결과)
| 결과 생략 |
해당 데이터 셋에 대한 구체적인 설명이 제공됩니다.
다음은 실제 회귀 데이터 셋인 Boston Housing 데이터 셋입니다. 이 데이터 셋은 범죄율, 찰스강과의 거리, 고속도로 접근성 등의 정보를 이용하여 1970년대 보스턴 인근의 여러 주택의 평균 가치를 예측한 것과 관련이 있습니다.
| from sklearn.datasets import load_boston boston = load_boston() print("Data shape: {}".format(boston.data.shape)) |
결과)
| Data shape: (506, 13) |
데이터 포인트의 수는 506개이며, 13개의 특성을 갖습니다. 다른 비슷한 데이터 셋 부분 출력을 breast cancer 코드와 비슷하게 실행해볼 수 있습니다.
'Python-머신 러닝 > Python-지도 학습 알고리즘' 카테고리의 다른 글
| 2. 지도 학습 알고리즘 (4) Decision Trees (0) | 2020.06.14 |
|---|---|
| 2. 지도 학습 알고리즘 (3) Naive Bayes Classifiers (0) | 2020.06.14 |
| 2. 지도 학습 알고리즘 (2) Linear Model (0) | 2020.06.14 |
| 2. 지도 학습 알고리즘 (1) k-Nearest Neighbors (k-NN) (0) | 2020.06.14 |
| 1. 지도 학습 모델링의 기본 (0) | 2020.06.13 |